
The way states fund schools is complex and is often measured with a number called per-pupil expenditure (PPE).
Before diving into Idaho’s financing of public education, it’s important to understand where that PPE number comes from and what it means.
Generally, PPE is calculated by taking the amount of money a district spends on students in a given year and dividing it by the number of students in that district.
But there are some nuances. A district’s expenditures usually excludes construction or new building costs. That’s because if a district built a new school one year, it would heavily skew its PPE numbers that year and that data would be less reliable.
Also, the denominator in the equation – students in a district – could be calculated using either the average daily attendance or enrollment. That matters because attendance tends to be lower than enrollment, and the pandemic has also resulted in higher levels of absenteeism.
The results also differ depending on how they’re calculated.
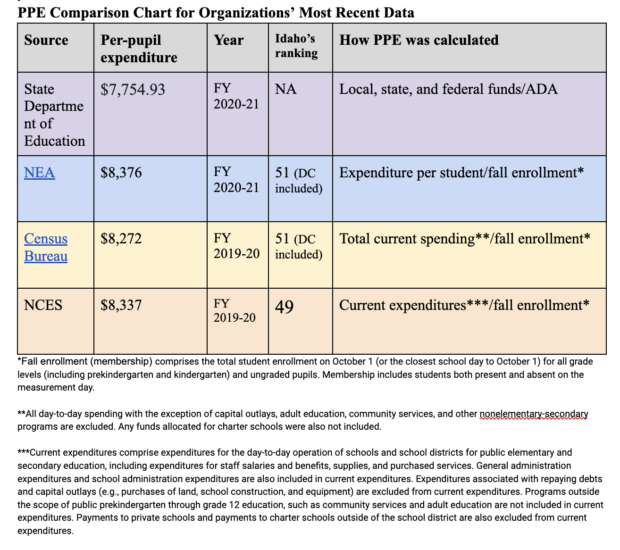
For example, the Census Bureau does not account for money spent on charter schools in its PPE calculation. The NCES, however, does.
Certain organizations like NCES and the Census Bureau also take longer to release their data because of their time-consuming fact-checking process, which includes multiple independent reviews. That means their most recent reports are usually on data from a year or two ago. So when reports come out, pay attention to the organization behind them and the fiscal year they represent.
Another wrinkle is that upcoming reports will continue to reflect one-time federal COVID funding that’s being poured into states.
But even for all the differences, most organizations still come up with numbers that are relatively close – and they still put Idaho in last place or close to it.
Read our in-depth article on what PPE numbers mean for education in Idaho.
PPE Comparison Chart for Organizations’ Most Recent Data
Comparing Idaho’s PPE to other states is an apples-to-oranges false equivalence
State-by-state comparisons don’t account for cost-of-living differences, which impact the amount of income or property taxes a state receives – and thereby the amount of revenue that can fund education. Plus, some states have unique money-making industries like technology or recreational marijuana. And each state has different school funding formulas and tolerance levels for debt.
The table below shows how Idaho has significantly less state and local revenue than some states and is unable to go into debt.
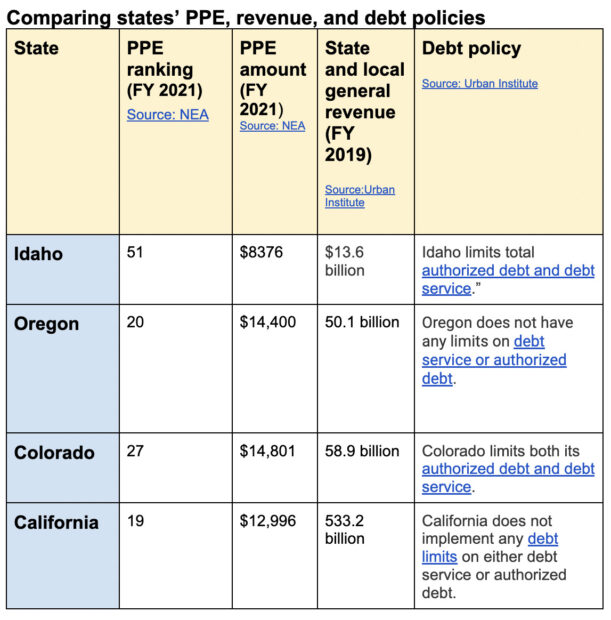
The data shows that Idaho tends to spend a greater percentage of its state budget on education than others, yet still lags in student spending. Some of the above factors – aversion to debt, lower cost of living, and a smaller economy – could help account for that discrepancy.
In fiscal year 2021, 55.8% of the state budget went to K-12 education – a typical percentage for Idaho. Most states on average contributed 47% of public school funding, according to the most recent data from the Census Bureau (2020).