Month: September 2019
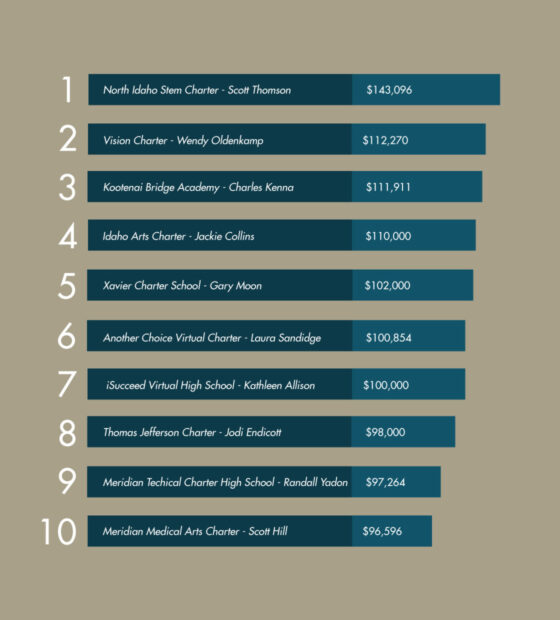
Top Charter Administrator Salaries
These salaries from the 2018-19 school year were reported by charters to the State Department of Education. These are base salaries and do not include extra perks. [numbers_source file=”http://www.idahoednews.org/wp-content/uploads/2018/02/Charter-Salaries_2017-2018_Numbers.xlsx” link_text=”2017 Charter Salaries”]
Teacher Work Days
This is the average number of days teachers were contracted to work during the 2018-19 school year. Contract days were reported by districts and charters to the State Department of Education. This is the average of the individual reports.
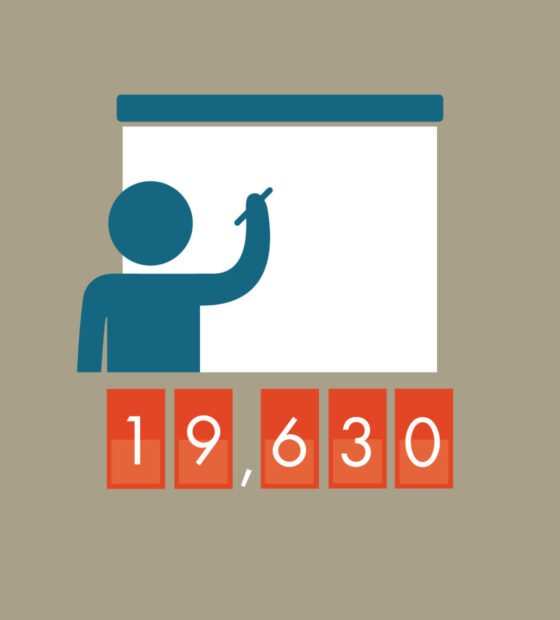
Teachers in Idaho
This calculation is the total of full and part-time instructional staff members from the 2018-19 school year. [numbers_source file=”http://www.idahoednews.org/wp-content/uploads/2018/02/Fun-Facts_2018.xlsx” link_text=”2018 Fun Facts”]
Average Teacher Salary
This calculation uses only the base salary of instructional staff members from the 2018-19 school year. The number includes teachers in districts and charters.
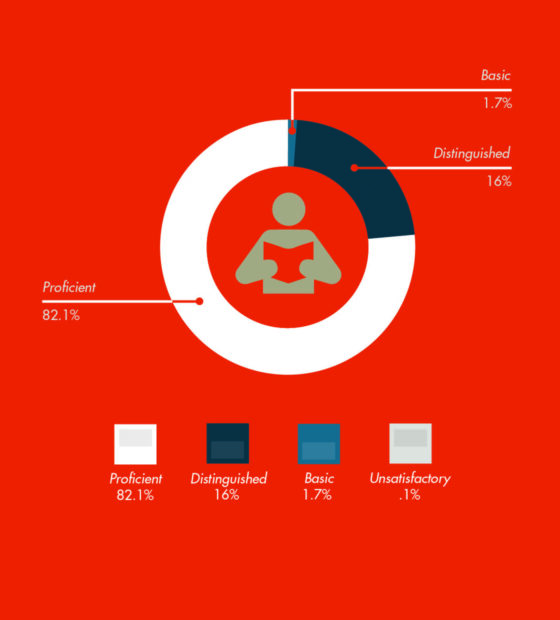
Teacher Performance
Districts are required to report teacher performance data to the State Department of Education. Teachers are rated on a four-numbered scale: 1 (unsatisfactory), 2 (needs improvement), 3 (proficient) and 4 (distinguished). Most teachers in Idaho earned a 3 or proficient mark during the 2018-19 school year.
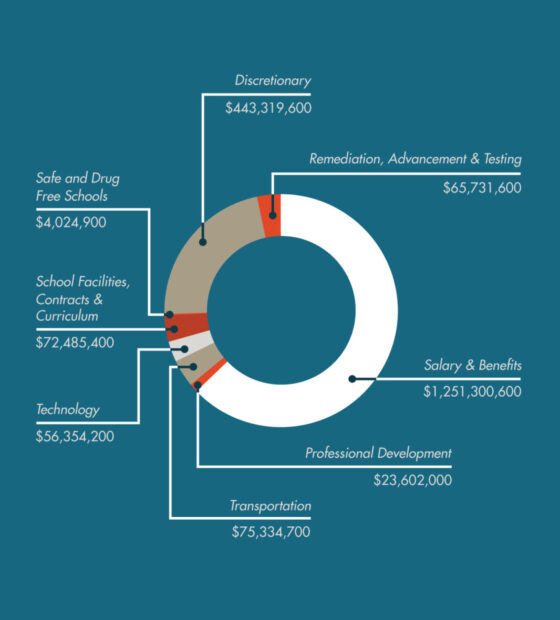
Public Schools Education Budget
$2.0 billion tax dollars devoted to public education in Idaho for the 2019-20 school year. This graphic breaks out how the money is allocated to districts and charters.
Average Superintendent Salary
This amount is calculated by averaging the salaries of all full-time superintendents from the 2018-19 school year. [numbers_source file=”http://www.idahoednews.org/wp-content/uploads/2018/02/Supt.-Salaries_2017-2018_Numbers.xlsx” link_text=”2017-2018 Superintendent Salaries”]
Students in Idaho
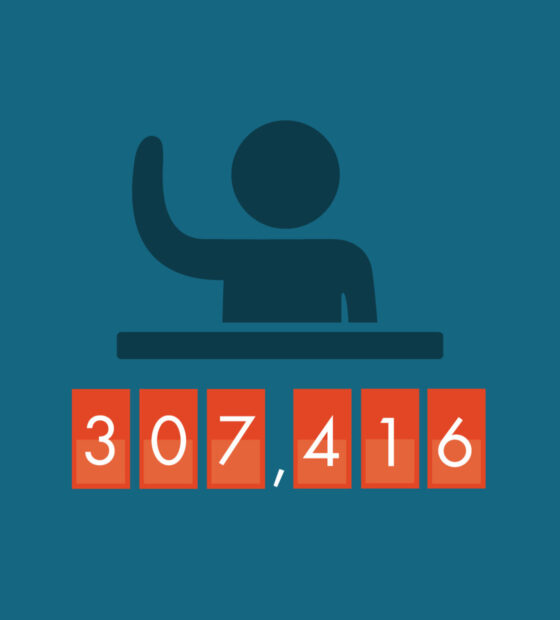
This is the approximate number of students attending Idaho public schools during the 2018-19 school year. The number includes students in charter and traditional public schools. [numbers_source file=”http://www.idahoednews.org/wp-content/uploads/2018/02/Enrollments-Fiscal-17-18_Numbers.xlsx” link_text=”Enrollment Summary”]
State Graduation Rate
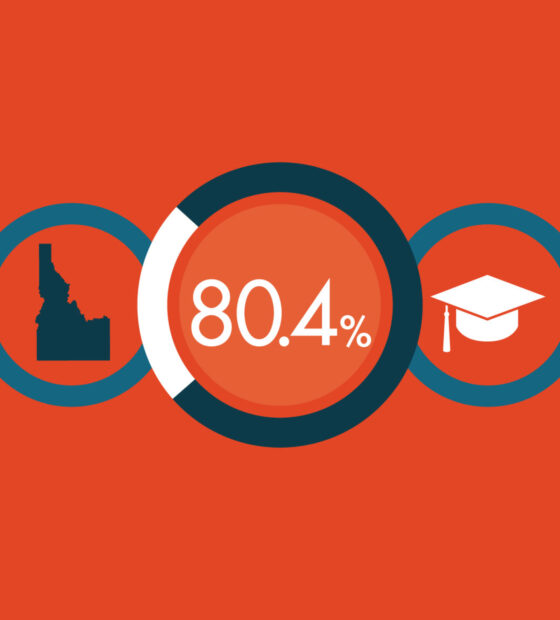
This percentage is calculated from the number of students who started high school and graduated in four years in May of 2018.
Daily Attendance
This is the total average daily attendance of students from across the state. About 17,000 students are absent each day. [numbers_source file=”http://www.idahoednews.org/wp-content/uploads/2018/02/Attendance-Fiscal-17-18_Numbers.xlsx” link_text=”Attendance Summary”]

